A powerful annual report is more than a compliance document; it's your nonprofit's most compelling storytelling asset. It's a chance to transform dry data into a narrative of impact, connecting donors to the heart of your mission and inspiring continued support. Yet, many organizations struggle to move beyond dense financials and generic updates. The challenge lies in creating a report that is not only informative but also engaging, visually appealing, and emotionally resonant.
This guide moves beyond theory to provide a strategic blueprint for crafting a document that captivates your audience. We'll explore exceptional nonprofit annual report examples and, more importantly, break down the tools and platforms used to create them. You will see firsthand how organizations leverage platforms like Canva, Visme, and others to build reports that drive engagement.
For each platform, we provide a detailed analysis, including:
- Strategic Breakdown: What makes the design and narrative effective.
- Actionable Takeaways: Replicable tactics you can apply immediately.
- Visual Examples: Screenshots to illustrate key points and direct links to explore further.
By the end, you will have a clear vision for transforming your next report from a simple summary into a powerful fundraising tool. We will show you not just what an excellent report looks like, but precisely how to build one for your own organization.
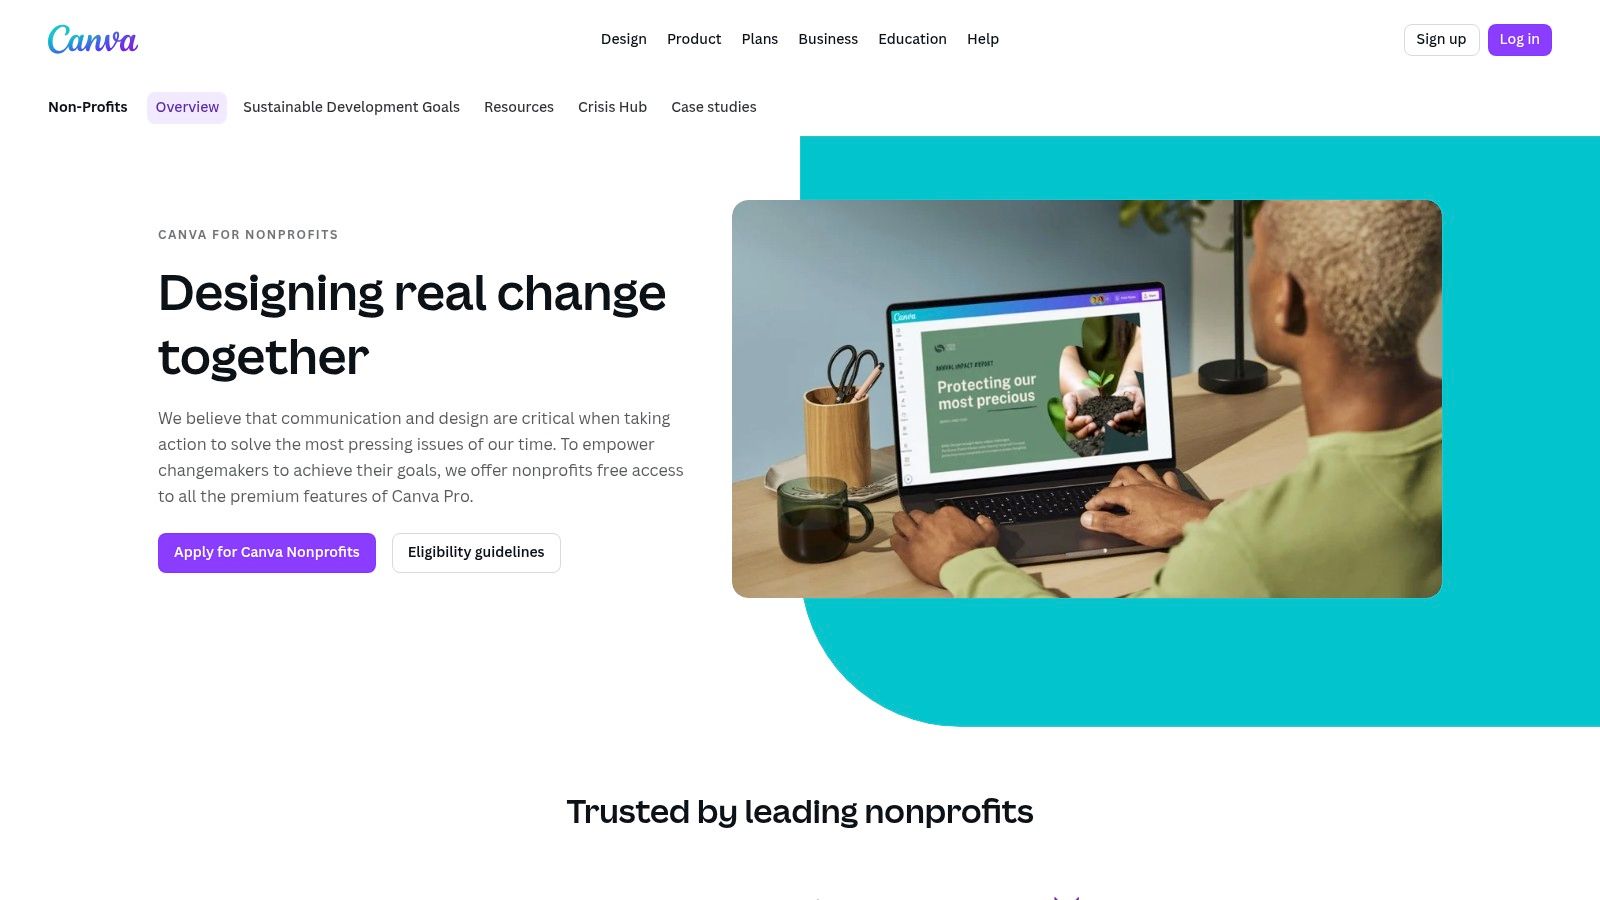
1. Canva for Nonprofits
Canva has become a go-to design tool for businesses of all sizes, but its dedicated program, Canva for Nonprofits, makes it an indispensable resource for organizations looking to create stunning annual reports without a professional designer. This platform provides eligible nonprofits with free access to Canva Pro, unlocking a powerful suite of tools specifically geared toward producing high-quality, branded marketing materials, including some of the most visually compelling nonprofit annual report examples available as templates.
The primary advantage of Canva is its vast library of professionally designed templates. Instead of starting from a blank page, your team can select a layout that aligns with your brand’s aesthetic and simply customize it with your own data, stories, and imagery. The user-friendly, drag-and-drop interface significantly lowers the barrier to entry, empowering anyone on your team to contribute to the report’s creation.
Strategic Analysis: Why It Works
Canva’s platform is built for brand consistency and collaborative efficiency. The Brand Kit feature allows you to preload your organization's specific colors, fonts, and logos. This ensures every page of your annual report adheres to your brand guidelines, creating a cohesive and professional final product.
Additionally, the real-time collaboration tools are a game-changer for nonprofit teams. Multiple users can work on the same document simultaneously, leaving comments and suggesting edits, which streamlines the review process and eliminates the need for endless email chains with PDF attachments. This collaborative environment ensures accuracy and saves valuable administrative time.
Actionable Takeaways & Best Practices
To get the most out of Canva for your next annual report, follow these practical steps:
- Establish Your Brand Kit First: Before you start designing, take 15 minutes to upload your logos, define your color palette, and set your primary and secondary fonts. This simple step will save hours of formatting time later.
- Use Templates as a Starting Point: Don't feel constrained by the original template design. Use its structure as a guide, but feel free to duplicate, delete, or rearrange pages to better fit your narrative and data flow.
- Leverage the Content Library: Your free Canva Pro access includes millions of stock photos, icons, and videos. Use high-quality visuals to break up text and illustrate your impact, making your report more engaging for readers.
| Feature | Benefit for Nonprofits |
|---|---|
| Free Canva Pro Access | Significant cost savings on premium design software (up to 50 seats). |
| Template Library | Accelerates the design process and provides professional layouts. |
| Real-Time Collaboration | Streamlines feedback and editing cycles among team members. |
| Brand Kit | Ensures brand consistency across all pages and communications. |
To access these benefits, eligible 501(c)(3) organizations must apply through Canva’s website. The review process is typically straightforward but is a required step before gaining free Pro access. While the vast majority of assets are free, be mindful that some premium templates or elements from the marketplace may require a separate purchase.
Website: https://www.canva.com/canva-for-nonprofits/
2. Etsy
While not a design platform itself, Etsy has emerged as a surprisingly valuable marketplace for nonprofits seeking professional, budget-friendly annual report templates. Independent designers and small creative agencies use the platform to sell pre-made, customizable templates for tools like Canva, Adobe InDesign, and Microsoft Word. This makes Etsy an excellent resource for sourcing unique and affordable nonprofit annual report examples that can be quickly adapted to fit your brand.
The key benefit of using Etsy is the sheer variety of styles and formats available at a low, one-time cost. Nonprofits can find everything from concise one-page impact summaries to comprehensive 20-page reports, often designed with a specific focus on donor engagement, impact storytelling, and clear financial transparency. This allows organizations to bypass the expense of hiring a graphic designer while still achieving a polished, professional look.
Strategic Analysis: Why It Works
Etsy provides a solution that balances cost, speed, and quality. For smaller nonprofits with limited budgets and staff, purchasing a template for under $25 is a highly efficient use of resources. The instant digital download model means there is no waiting period; you can purchase a design and begin customizing it within minutes, a critical advantage when facing tight deadlines.
Furthermore, the platform's review and rating system offers a layer of quality control. Before purchasing, you can read feedback from other nonprofit professionals who have used the template, giving you confidence in the seller's design quality and customer support. Many sellers also include helpful setup guides or video tutorials, making the customization process smoother for team members who may not be design experts.
Actionable Takeaways & Best Practices
To effectively leverage Etsy for your annual report, consider these steps:
- Verify Software Compatibility: Before purchasing, carefully read the product description to ensure the template files are compatible with the software your team uses (e.g., Canva, InDesign, Word).
- Read Seller Reviews and Policies: Pay close attention to recent reviews and the seller's shop policies regarding support and licensing. A well-regarded seller is more likely to provide a high-quality product and assistance if you run into issues.
- Look for Bundles and Packages: Some Etsy sellers offer bundles that include not only an annual report template but also matching social media graphics, presentation slides, or thank-you cards, helping you create a cohesive campaign around your report.
| Feature | Benefit for Nonprofits |
|---|---|
| Affordable One-Time Cost | Extremely budget-friendly, with most templates costing between $5 and $25. |
| Wide Variety of Styles | Access to hundreds of unique designs from different creators, ensuring a good brand fit. |
| Instant Digital Downloads | Enables immediate access to files, accelerating the report creation timeline. |
| Customer Reviews | Provides social proof and helps verify the quality and reliability of a template before purchase. |
The main consideration when using Etsy is that quality and support can vary significantly from one seller to another. Always perform due diligence by checking reviews and confirming file formats. Despite this, the platform offers an unparalleled combination of affordability and design diversity for creating compelling reports.
Website: https://www.etsy.com/market/nonprofit_annual_report_template
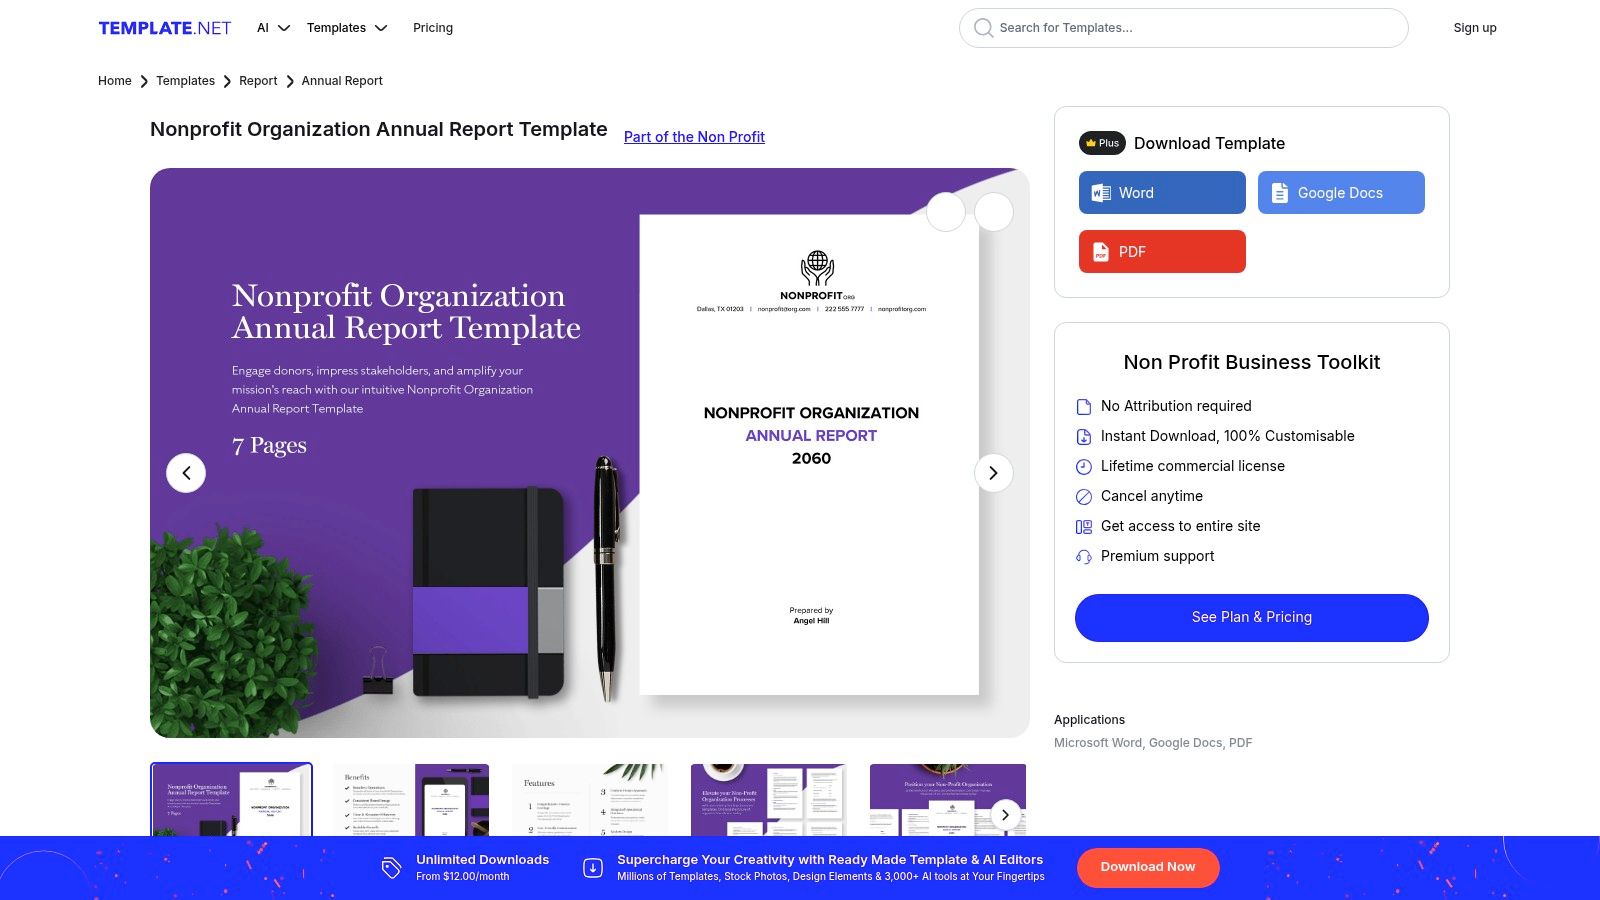
3. Template.net
For nonprofits that need to create a functional report quickly and prefer working in familiar software like Microsoft Word or Google Docs, Template.net is a practical resource. It offers a wide variety of downloadable templates designed with standard nonprofit sections already built in, such as mission statements, financial summaries, and donor recognition pages. This makes it a strong choice for organizations seeking straightforward, fill-in-the-blank nonprofit annual report examples that prioritize content over complex custom design.
The key benefit of Template.net is its focus on compatibility with common office software. Instead of learning a new design platform, your team can download a file in a familiar format (e.g., .docx, .gdoc, .ai) and begin editing immediately. This significantly reduces the learning curve and allows for rapid content population, making it ideal for teams with limited design experience or tight deadlines.
Strategic Analysis: Why It Works
Template.net’s strength lies in its structural efficiency and accessibility. The pre-built sections provide a logical narrative flow that guides users through the essential components of an effective annual report. This framework ensures that crucial information, like financial health and program outcomes, is not overlooked, which is vital for maintaining transparency with stakeholders.
Furthermore, the platform caters to the practical reality that many nonprofits operate within the Microsoft or Google ecosystems. By providing templates in these native formats, it eliminates the cumbersome process of exporting and reformatting files, which often leads to broken layouts and wasted time. This approach ensures that the report's structure remains intact, allowing the team to focus solely on the quality of the content and storytelling.
Actionable Takeaways & Best Practices
To effectively use Template.net for your annual report, consider the following strategies:
- Filter by File Format: Start your search by filtering for the specific file type your team is most comfortable with, such as Google Docs or Word. This will ensure a seamless editing experience from the start.
- Customize Beyond the Text: While these are fill-in-the-blank templates, you can still infuse your brand's personality. Replace all placeholder images with high-quality photos of your work and adjust the color scheme to match your brand guidelines.
- Review Plan Details Carefully: While many templates are available, some of the most polished designs may require a subscription. Before committing, review the terms of the membership plan to understand download limits and usage rights.
| Feature | Benefit for Nonprofits |
|---|---|
| Multiple File Formats | Edit reports directly in familiar software like Word and Google Docs. |
| Pre-Built Sections | Provides a structured outline covering key areas like financials and impact. |
| Broad Template Library | Offers a wide range of styles, from simple one-pagers to comprehensive reports. |
| Low Skill Requirement | Minimal to no design experience is needed to produce a professional-looking document. |
While Template.net offers some free downloads, access to its full premium library requires a subscription. It's important to note that user reviews on third-party sites are mixed, so it is advisable to carefully read the terms of any paid plan before purchasing.
Website: https://www.template.net/editable/151241/nonprofit-organization-annual-report
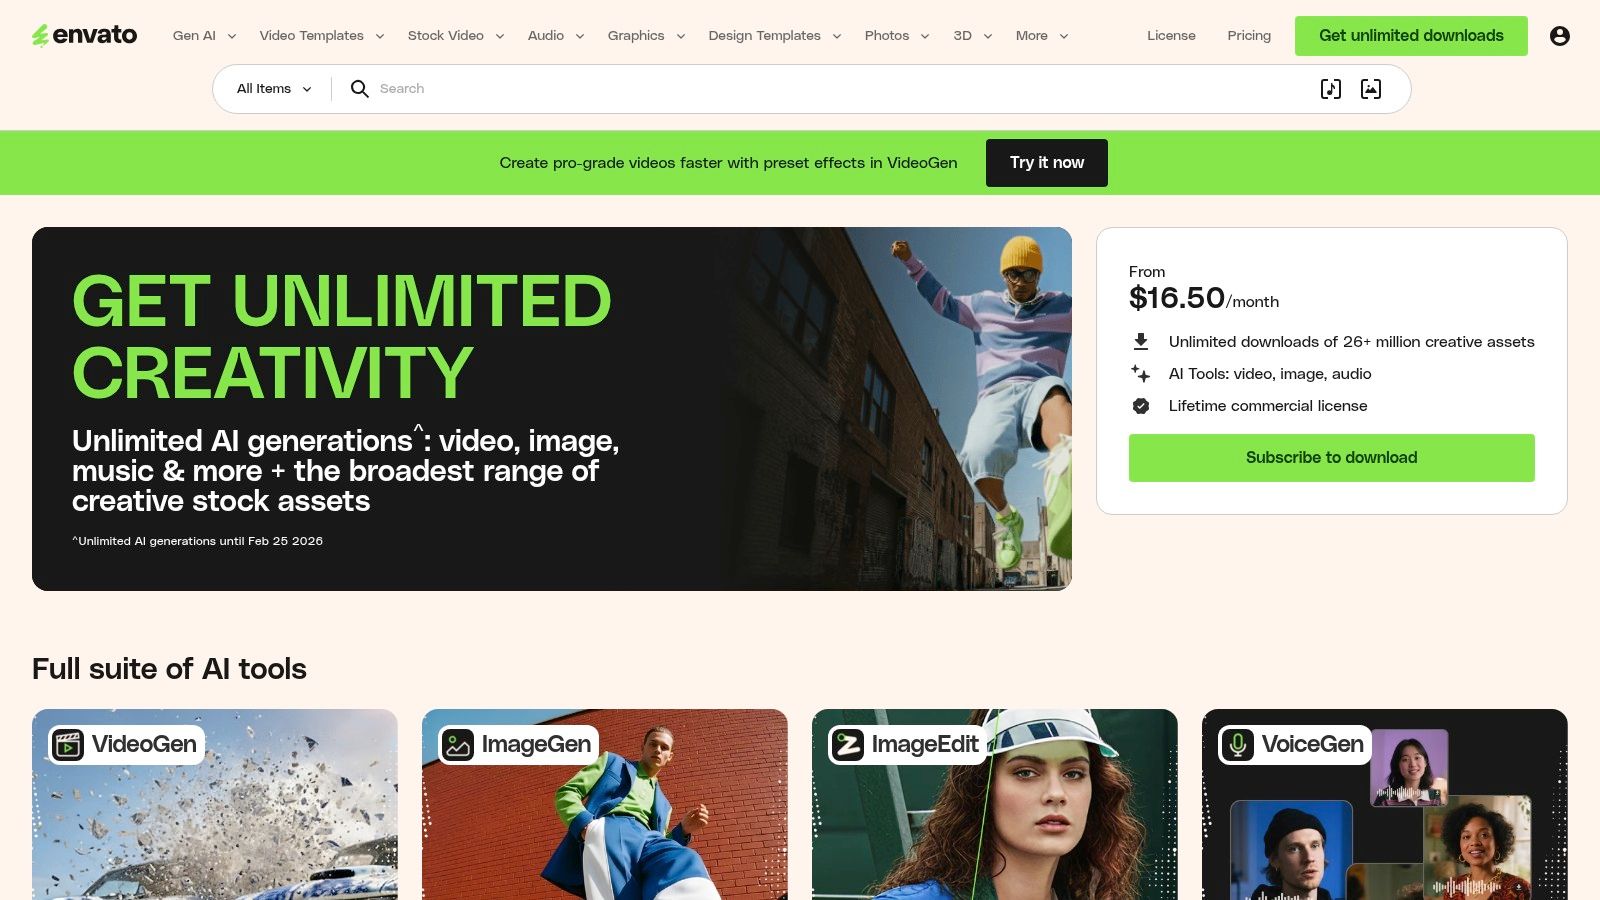
4. Envato Elements
For nonprofits that need maximum flexibility and a wide array of professionally crafted design assets, Envato Elements offers an exceptional value proposition. It is a subscription-based library that provides unlimited downloads of creative assets, including a massive collection of annual report templates compatible with Adobe InDesign, Illustrator, and Microsoft Word. This makes it an ideal resource for organizations with in-house design capabilities or those wanting a more traditional, print-ready final product.
Unlike platforms focused on a single online tool, Envato Elements provides the source files, giving your team complete creative control. You can find everything from sleek, corporate-style layouts to more creative and illustrative designs, ensuring you can find nonprofit annual report examples that align perfectly with your organization's brand and tone. The subscription model is particularly cost-effective if your team produces other marketing materials, as it includes stock photos, icons, fonts, and presentation templates.
Strategic Analysis: Why It Works
The core strength of Envato Elements is its professional-grade quality and versatility. Templates are typically created by experienced graphic designers and are built with best practices in mind, featuring well-organized layers, paragraph styles, and print-ready specifications (like CMYK color mode and bleed settings). This saves significant setup time and reduces the risk of technical printing errors.
Furthermore, the platform's all-inclusive license simplifies legal compliance. A single subscription grants you broad commercial rights to use any downloaded asset in your projects, eliminating the need to track individual licenses for photos, fonts, and graphics. This is a huge benefit for busy nonprofit teams who need to ensure all their communications are properly licensed without added administrative overhead.
Actionable Takeaways & Best Practices
To effectively leverage Envato Elements for your annual report, consider these strategies:
- Filter by Software: Start your search by filtering for templates compatible with the software your team uses most proficiently, whether it's InDesign for professional layout or Microsoft Word for accessibility.
- Customize Beyond Color and Text: While many templates are designed for corporate use, you can easily adapt them. Swap out business-centric icons for mission-focused ones and replace stock photos with powerful images of your community and work in action.
- Download a "Brand Pack": Don't just download the report template. Use your subscription to grab matching icons, a complementary font, and high-quality photos to create a fully cohesive visual identity for the entire project.
| Feature | Benefit for Nonprofits |
|---|---|
| Unlimited Downloads | One subscription covers all asset needs (reports, social media, etc.). |
| Professional-Grade Files | Ensures high-quality, print-ready results without technical issues. |
| Wide Template Variety | Access to diverse styles fitting any brand, from formal to creative. |
| Simple Commercial License | Avoids complex licensing for photos, fonts, and graphics. |
A key consideration is the subscription cost, as there is no option to purchase a single file. However, for organizations that regularly produce marketing materials, the value of unlimited access often outweighs the monthly or annual fee. Be prepared to slightly modify templates, as many are designed with a general business audience in mind and may require minor relabeling for a nonprofit context.
Website: https://elements.envato.com/
5. Visme
Visme is a comprehensive design platform that excels in creating interactive and data-driven presentations, infographics, and reports. For organizations aiming to produce a digital-first annual report, Visme offers a powerful alternative to static PDFs. It provides a robust suite of tools focused on data visualization and interactivity, allowing nonprofits to transform standard impact metrics into engaging digital experiences, complete with animations, charts, and embedded media.
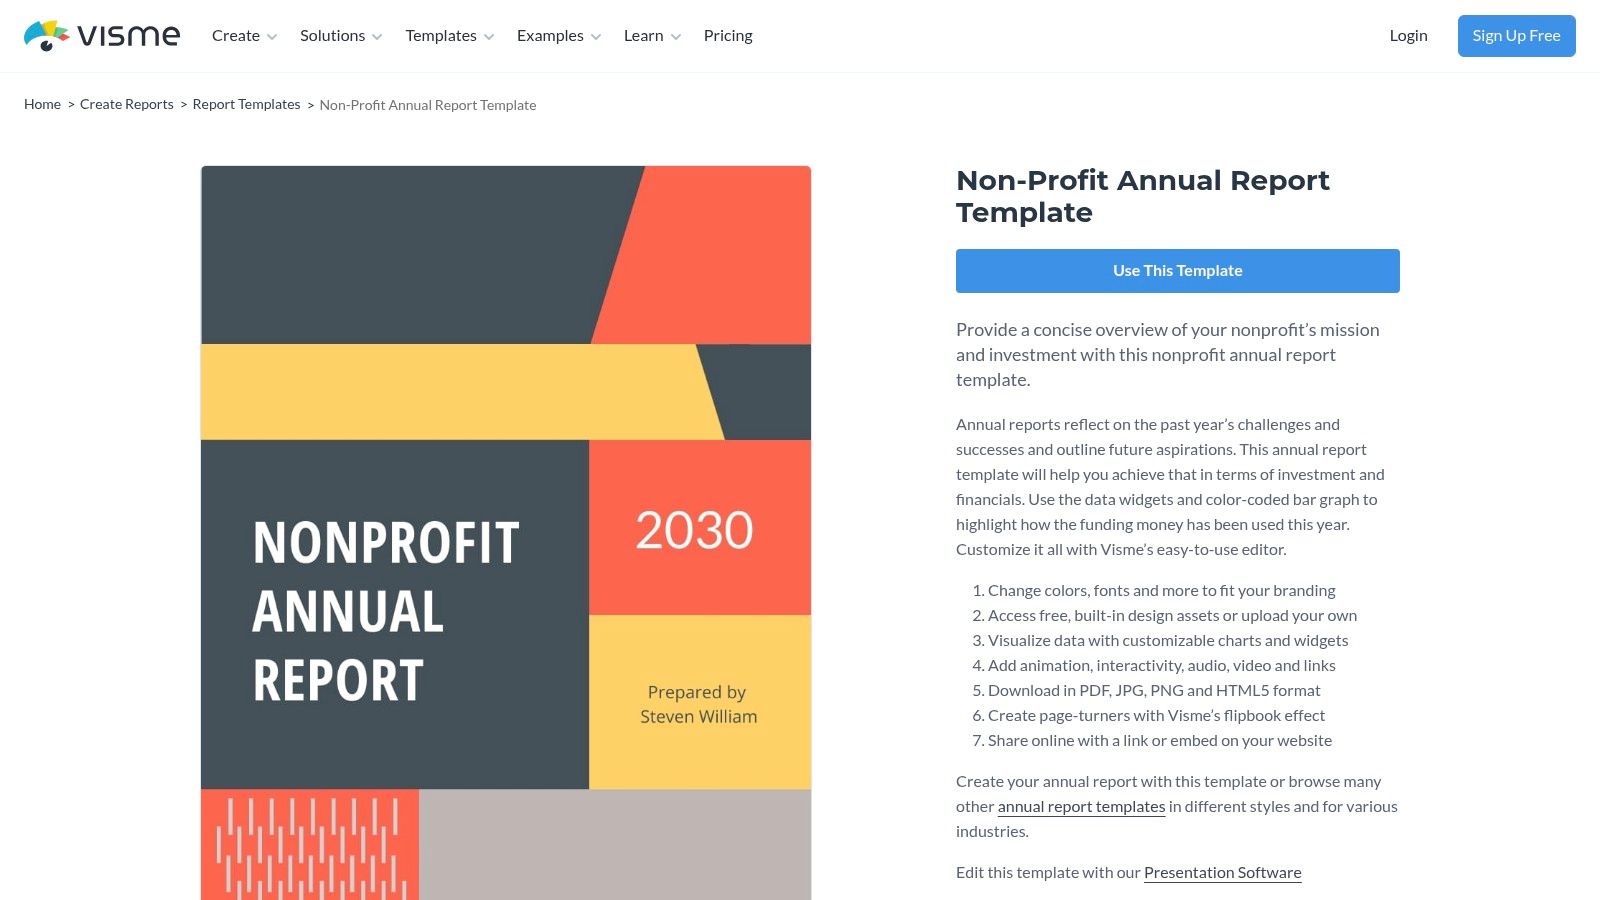
The platform's key differentiator is its ability to generate shareable online reports and flipbooks. Instead of just sending a downloadable file, you can provide stakeholders with a live link to an immersive report that feels more like a microsite. This approach is ideal for capturing the attention of a digital-savvy audience and encourages social sharing, extending the reach of your impact story.
Strategic Analysis: Why It Works
Visme’s strength lies in its capacity to bring data to life. While a simple bar chart in a PDF is informative, Visme allows you to create animated charts that populate as the user scrolls, interactive maps that reveal data on hover, and embedded videos that tell powerful stories. This transforms the report from a passive document into an active experience, significantly increasing reader engagement and comprehension.
This focus on interactivity makes Visme’s nonprofit annual report examples particularly effective for online distribution. Sharing a direct link ensures the report is viewed exactly as intended, with all dynamic elements intact, which is often lost when exporting to a flat PDF. The ability to embed the report directly into your website also creates a seamless user journey, keeping donors and supporters within your digital ecosystem.
Actionable Takeaways & Best Practices
To leverage Visme for a dynamic annual report, consider these strategies:
- Prioritize a Digital-First Narrative: Design your report with online viewing in mind. Use animations to guide the reader’s eye, embed video testimonials, and link out to specific campaign pages on your website for deeper dives.
- Make Data Interactive: Instead of static infographics, use Visme’s data widgets to create filterable charts or clickable maps. This allows stakeholders to explore the data that is most relevant to them, personalizing their experience.
- Use the Shareable Link: Distribute your report primarily through the live Visme link in emails and social media posts. This not only guarantees the best viewing experience but also allows you to track analytics on views and engagement.
| Feature | Benefit for Nonprofits |
|---|---|
| Interactive Elements | Boosts reader engagement with animations, pop-ups, and embedded media. |
| Advanced Data Visualization | Simplifies complex financial and impact data through dynamic charts and maps. |
| Shareable Links & Embeds | Facilitates easy digital distribution and website integration. |
| Variety of Export Options | Offers flexibility with exports to HTML5, PDF, JPG, and PNG formats. |
Visme offers special discounts for nonprofit organizations, but these are not automatically applied and require you to contact their team for verification. While many features are available on free plans, advanced functionality like HTML5 exporting and analytics typically requires a paid subscription.
Website: https://www.visme.co/templates/reports/nonprofit-annual-report-1425292545/
6. Piktochart
Piktochart is a powerful web-based infographic and design tool that excels at helping organizations visualize data and complex information. For nonprofits, it offers a streamlined way to create concise, engaging, and highly visual annual reports. The platform is particularly effective for organizations looking to produce shorter, infographic-style impact reports that grab attention and communicate key outcomes quickly, making it a valuable source for unique nonprofit annual report examples.
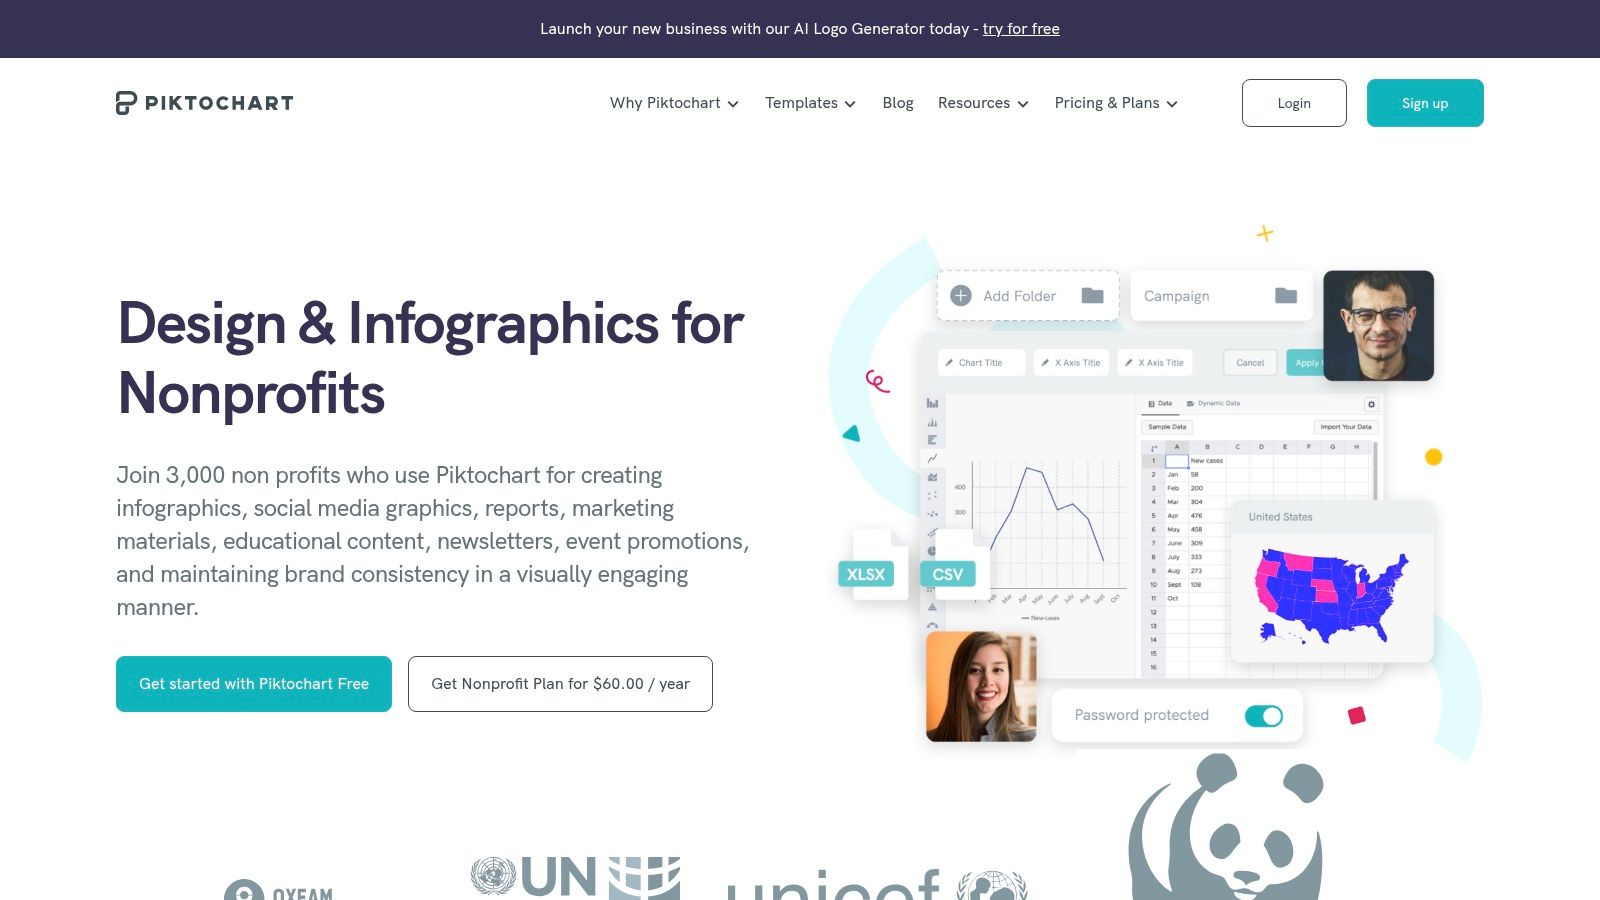
The core strength of Piktochart lies in its focus on data-driven storytelling. Its templates are specifically designed to turn statistics, financials, and program metrics into clear, digestible charts, graphs, and maps. This makes it an ideal choice for nonprofits that want to move away from text-heavy documents and toward a format that is more shareable on social media and in email newsletters.
Strategic Analysis: Why It Works
Piktochart simplifies the design process by prioritizing ease of use and brand alignment. Its Brand Assets tool allows you to automatically extract your website's colors and upload logos and custom fonts. This feature ensures that even a one-page "annual review" maintains a professional look consistent with your organization's overall branding.
The platform's collaborative features enable team members to work together on a report, leave comments, and share drafts for feedback. This is especially useful for small teams where multiple people wear different hats, from data collection to final design approval. The focus on turning numbers into visuals helps stakeholders immediately grasp the scale of your impact without getting lost in dense paragraphs.
Actionable Takeaways & Best Practices
To effectively use Piktochart for your annual report, consider these strategies:
- Focus on a Central Narrative: Since Piktochart is best for shorter formats, decide on the single most important story you want to tell. Build your charts and visuals around that core message.
- Use the "Annual Review" Templates: Explore templates specifically labeled as "annual reviews" or "impact reports." These are often single-page designs that are perfect for a summary report you can share widely.
- Prioritize Data Visualization: Don't just type numbers into a text box. Use Piktochart’s charting tools to create pie charts, bar graphs, and custom maps to make your metrics more compelling and memorable.
| Feature | Benefit for Nonprofits |
|---|---|
| Nonprofit Discount | Makes the Pro plan highly affordable (~$60/user/year), unlocking premium features. |
| Infographic-Style Templates | Perfect for creating short, shareable impact summaries instead of long-form reports. |
| Brand Assets Tool | Quickly applies your brand colors, logos, and fonts for a consistent look. |
| Data Visualization Tools | Easily transforms complex data and statistics into engaging charts and graphs. |
Piktochart offers a generous discount for registered nonprofit organizations, making its Pro features very accessible. To qualify, you will need to apply through their dedicated nonprofit portal. While the platform is user-friendly, be aware that certain export options, like high-resolution PDFs or PowerPoint files, are tied to specific subscription tiers.
Website: https://piktochart.com/nonprofit/
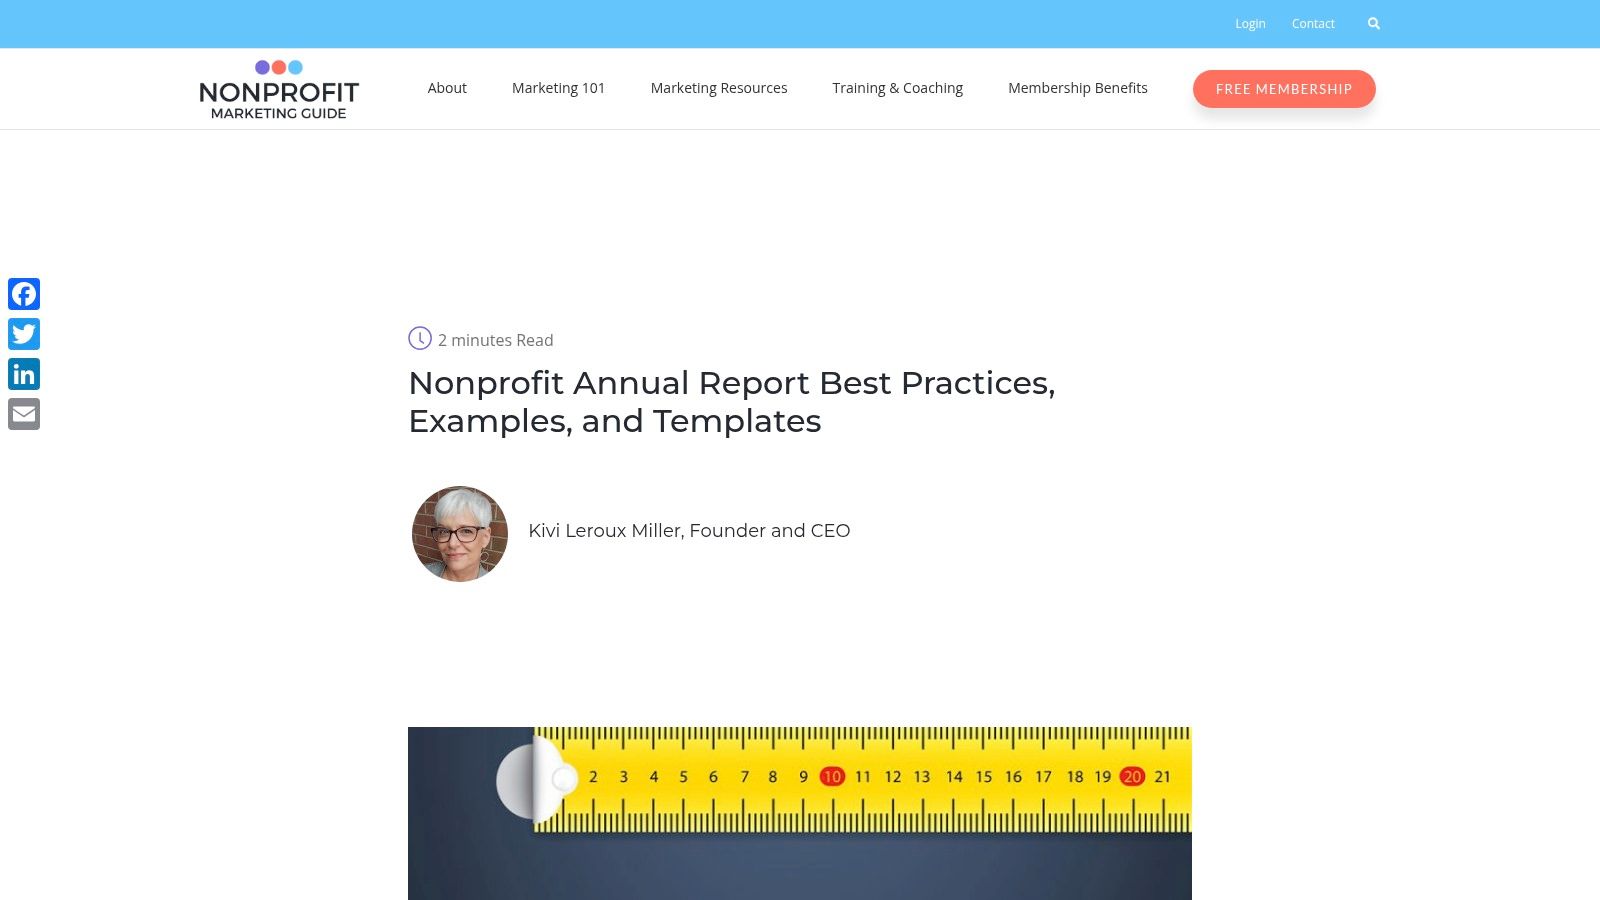
7. Nonprofit Marketing Guide
Nonprofit Marketing Guide serves as a strategic compass rather than a design tool, offering a rich library of resources, case studies, and expert analysis. It's a critical first stop for organizations seeking inspiration and best practices before diving into the creation process. This platform excels at showcasing a diverse range of nonprofit annual report examples, from comprehensive digital reports to concise infographic formats, helping you define your strategy before committing to a specific layout or template.
The primary advantage of this resource is its focus on the "why" behind the "what." Instead of just presenting templates, the site breaks down why certain reports are effective, providing donor-centered guidance from seasoned marketing professionals. This approach helps nonprofits think more strategically about their content, ensuring their final report is not just visually appealing but also impactful and persuasive.
Strategic Analysis: Why It Works
Nonprofit Marketing Guide champions the idea of modern, reader-friendly report formats. It moves beyond the traditional, text-heavy document to showcase shorter, more engaging alternatives like postcards, one-pagers, and video reports. This is invaluable for organizations with limited resources or those looking to capture the attention of a time-strapped audience. The site provides the strategic foundation needed to justify a shift toward these more modern formats.
The platform's content is rooted in practical application and learning. By curating case studies and linking to live examples, it allows your team to see what’s working for other organizations in the sector. This process of discovery and analysis helps you scope your project effectively, ensuring you collect the right data and stories long before you open a design program.
Actionable Takeaways & Best Practices
To leverage the Nonprofit Marketing Guide for your next report, use these practical steps:
- Gather Inspiration First: Before you start writing or designing, browse their curated lists of annual and impact reports. Pay attention to different formats and storytelling techniques to find what resonates with your organization’s mission.
- Explore Shorter Formats: Seriously consider if a multi-page PDF is necessary. The guide provides excellent case studies on postcards and infographics that can deliver high impact with less effort.
- Use Their Tips as a Checklist: Consult their articles on best practices to create a content checklist. This ensures you include essential elements like a letter from the director, clear financial summaries, and powerful calls to action.
| Feature | Benefit for Nonprofits |
|---|---|
| Curated Report Examples | Provides high-quality inspiration for content, design, and storytelling. |
| Focus on Modern Formats | Introduces effective, time-saving alternatives like infographics and videos. |
| Expert Marketing Guidance | Helps teams develop a donor-centered strategy before production begins. |
| Case Studies & How-Tos | Offers practical, real-world insights into what makes a report successful. |
Nonprofit Marketing Guide is a free resource hub, so there are no access requirements. It is not a design platform or template marketplace; instead, it provides the strategic knowledge to inform your choices on other platforms. While browsing, be sure to check the publication dates on articles, as some older posts might reference trends that have since evolved.
Top 7 Nonprofit Annual Report Resources
| Solution | Implementation (🔄) | Resources & Cost (⚡) | Expected Outcomes (📊⭐) | Ideal Use Cases (💡) | Key Advantages (⭐) |
|---|---|---|---|---|---|
| Canva for Nonprofits | 🔄 Low — template-based, collaborative | ⚡ Low for eligible orgs (free Pro up to 50 seats); web-only | 📊 Polished, brand-consistent reports; ⭐⭐⭐ | 💡 Teams wanting fast, co-created print/web reports | ⭐ Free Pro for eligible nonprofits; Brand Kit; stock library |
| Etsy | 🔄 Medium — buy, verify files/formats per seller | ⚡ Very low per item (~$5–$25); instant download | 📊 Variable quality; donor-focused layouts; ⭐⭐ | 💡 Quick, low-budget purchases of one-off templates | ⭐ Wide stylistic variety; cheap and immediate |
| Template.net | 🔄 Low — fill-in docs in familiar editors | ⚡ Low–Moderate; some free, best content behind membership | 📊 Structured, standard nonprofit sections; ⭐⭐ | 💡 Teams wanting Word/Google Doc editing and standard sections | ⭐ Multiple file formats; minimal design skills needed |
| Envato Elements | 🔄 Medium–High — may require DTP tools (InDesign/AI) | ⚡ Subscription cost; great value if needing many assets | 📊 Professional, print-ready templates and assets; ⭐⭐⭐ | 💡 Organizations needing many templates/assets or print quality | ⭐ Unlimited downloads under one license; broad asset library |
| Visme | 🔄 Medium — interactive widgets and data tools to learn | ⚡ Moderate; paid plans for advanced exports; discounts vary | 📊 High digital engagement and data viz; ⭐⭐⭐ | 💡 Digital-first/interactive impact reports and embeds | ⭐ Strong data visualization; interactive export options |
| Piktochart | 🔄 Low–Medium — easy-edit infographic templates | ⚡ Low–Moderate; nonprofit discount (~$60/user/yr) | 📊 Effective for one-page/short infographic reports; ⭐⭐ | 💡 Short annual reviews, infographics, slides | ⭐ Fast infographic-first reports; brand asset tools |
| Nonprofit Marketing Guide | 🔄 Low — research and guidance hub | ⚡ Low (mostly free content); not a template provider | 📊 Strategic clarity and best-practice inspiration; ⭐⭐ | 💡 Idea gathering and planning before design/purchase | ⭐ Expert case studies, examples, and practical tips |
Streamline Your Reporting and Amplify Your Impact with OpsHub
Throughout this guide, we've explored a diverse collection of powerful nonprofit annual report examples, moving beyond simple aesthetics to dissect the strategic elements that make them truly effective. We've seen how organizations like the Malala Fund use bold typography and compelling photography to command attention, while others leverage infographics and data visualization to make complex impact metrics accessible and engaging.
The core lesson is clear: a successful annual report is more than a document; it's a strategic communication asset. It's a blend of authentic storytelling, transparent data, and thoughtful design that honors your donors' contributions and inspires continued support. From the minimalist, data-forward approach to the deeply personal narrative-driven format, each example provides a replicable blueprint for transforming your own reporting.
Key Takeaways for Your Next Annual Report
As you prepare to create your next report, keep these critical insights at the forefront of your strategy:
- Storytelling is paramount. Your data tells a story, but it needs a human element. Connect your metrics to the real-world impact on the communities you serve. Use personal anecdotes, powerful quotes, and high-quality imagery to evoke an emotional response.
- Design for readability. Your audience is busy. Utilize white space, clear headings, and visual hierarchies to guide readers through the content. Break up long blocks of text with pull quotes, icons, and infographics to maintain engagement.
- Data transparency builds trust. Don't shy away from presenting clear financial information and program metrics. An honest and straightforward presentation of your data demonstrates accountability and reinforces donor confidence in your organization's stewardship.
- Acknowledge your supporters. Your annual report is a prime opportunity to celebrate the community that makes your work possible. Ensure your donor recognition is prominent, personal, and heartfelt.
The Foundation of a Great Report: Clean, Accessible Data
Creating a report that incorporates these best practices hinges on one crucial element: having reliable, well-organized data at your fingertips. The most beautifully designed report will fall flat if the information it presents is inaccurate, incomplete, or difficult to compile. This is often the most significant challenge for nonprofit teams, who spend countless hours manually chasing down figures from disparate spreadsheets, CRMs, and project management tools.
This is precisely where an operational hub becomes a game-changer. Imagine a single source of truth where your program outcomes, fundraising data, volunteer hours, and financial metrics are automatically consolidated and updated in real time. Instead of spending weeks on data collection, your team can access a pre-populated dashboard, ready for analysis.
This streamlined process does more than just save time; it fundamentally improves the quality of your report. With a platform like OpsHub, you can:
- Automate Data Aggregation: Connect your various software tools to automatically pull key performance indicators into a centralized dashboard, eliminating manual entry and reducing the risk of human error.
- Identify Compelling Narratives: Use AI-powered analytics to spot trends and uncover the most impactful stories hidden within your data, ensuring your report highlights your most significant achievements.
- Ensure Accuracy and Consistency: With a unified data source, you guarantee that the numbers in your report are always current and consistent with your internal records, building a foundation of trust with your stakeholders.
By unifying your operations, you transform your annual reporting process from a reactive, time-consuming task into a proactive, strategic opportunity. This allows your team to shift its focus from administrative burdens to the creative and strategic work of crafting a narrative that truly resonates with your audience and amplifies your mission's impact.
Ready to build your next annual report on a foundation of clean, accessible data? OpsHub unifies your tools, automates your workflows, and provides the real-time insights you need to tell your most powerful impact story. Discover how you can streamline your reporting process and focus on what matters most by visiting OpsHub today.
Share This Story, Choose Your Platform!
TUNE IN
OpsHub Signal publishes analysis, essays, and field notes on operations, capital, policy, and systems design. Subscribe to receive a weekly briefing that cuts through noise and delivers what actually matters to operators.